Four questions for your growth plan
Published 13 Oct 2026
This is the session I gave at Beauty Bulb Live on 7 October 2026, written up. I am Yurii Blazhevych, director at Antevon, and I build forecasts for beauty brands.
You already have a growth plan: a new retailer, more stores, a campaign with a creator, a hero product in a second market. Every number in that plan is a forecast, whether anyone called it that or not. The useful question is what your forecast assumes, and whether you could supply it if it came true. A campaign that works and cannot be supplied is a campaign you paid for twice: once for the media, once for the empty shelf.
I would ask these four of any growth plan, including my own.
The one-page version, as handed out on the day (PDF)
Where did the rate of sale come from?
Every plan has a rate of sale inside it: units per store per week, or units per week on a site.
For an existing line at an existing retailer, this is a reporting question. You have the history. For new distribution there is no history, and that is the actual problem.
What you can do is build the number from the nearest real evidence, and be clear about which one you used: your own comparable product in a comparable retailer, a sister size or shade, or the retailer’s category benchmark, which their buyer will often give you if you ask a specific question. You can also use your own website’s sales, scaled down, because your own site sells to people who came looking for you, and a shelf does not.
Then the part people skip: write it as a range.
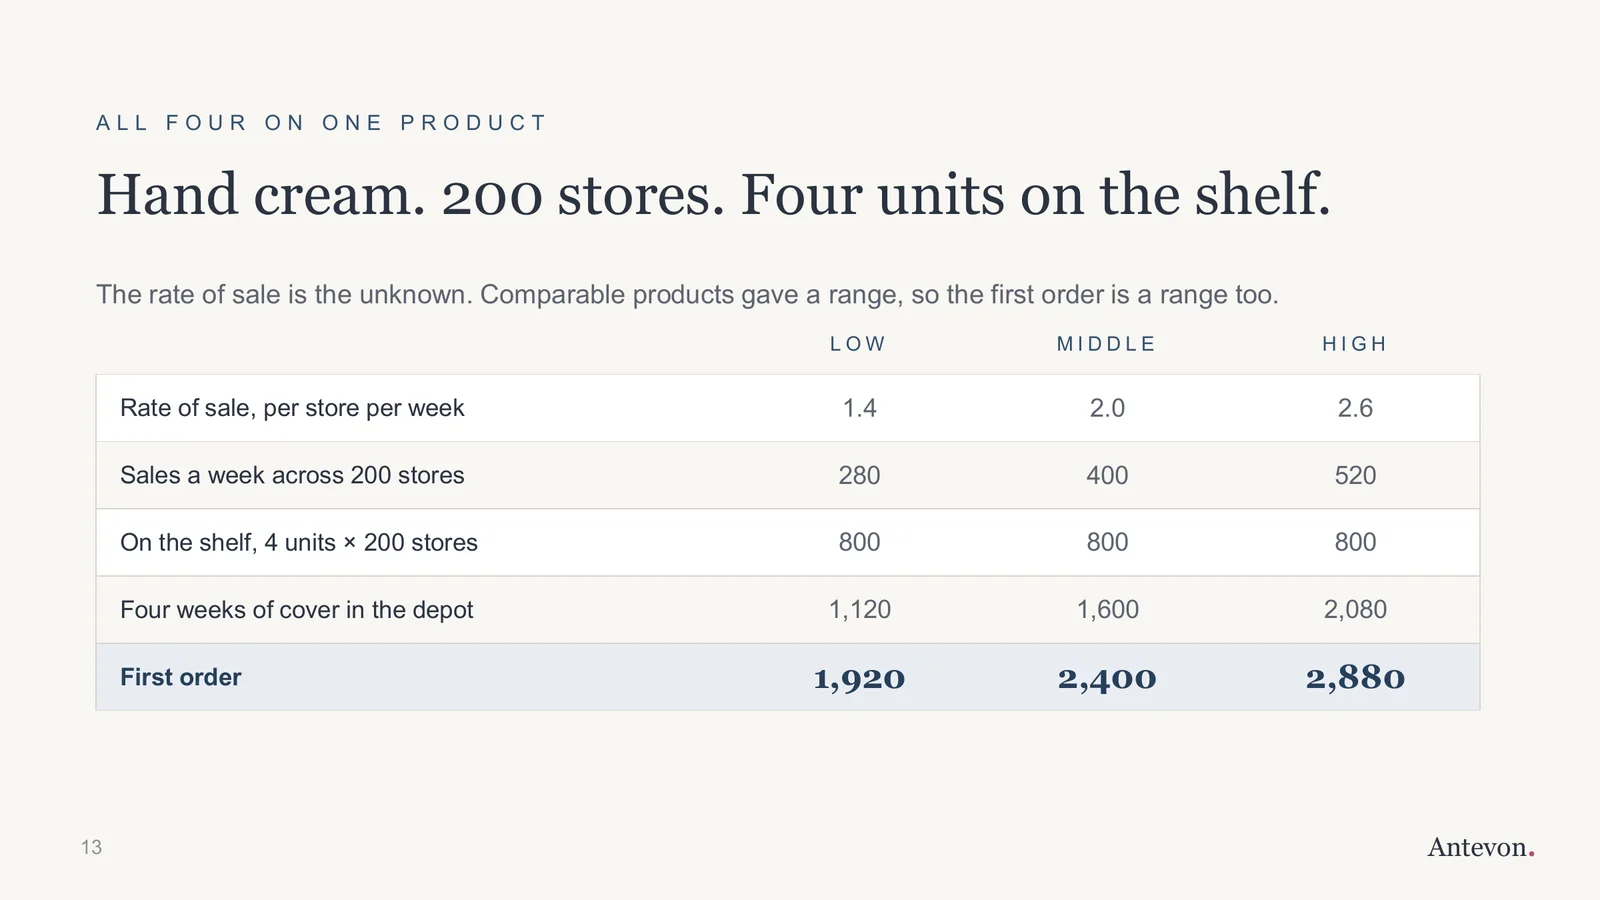
Take a hand cream going into 200 stores. The first order fills the shelves, four units in each store, and holds four weeks of sales in the depot. Comparable products gave a rate of sale between 1.4 and 2.6 per store per week.
At 1.4, the first order is 1,920 units. At 2.0, it is 2,400. At 2.6, it is 2,880. Same listing, same buyer, same week, and nearly a thousand units of difference in cash, production time and a promise to the retailer.
A forecast is a middle and a width. The width is the range around the middle: how far the number can reasonably sit either side. Everyone asks for the middle, because a single number fits in an email. The width is what should guide the decisions. A wide range on a new listing is correct. It tells you the size of the bet before you place it. A single number with no range around it is still a guess. It only looks more confident.
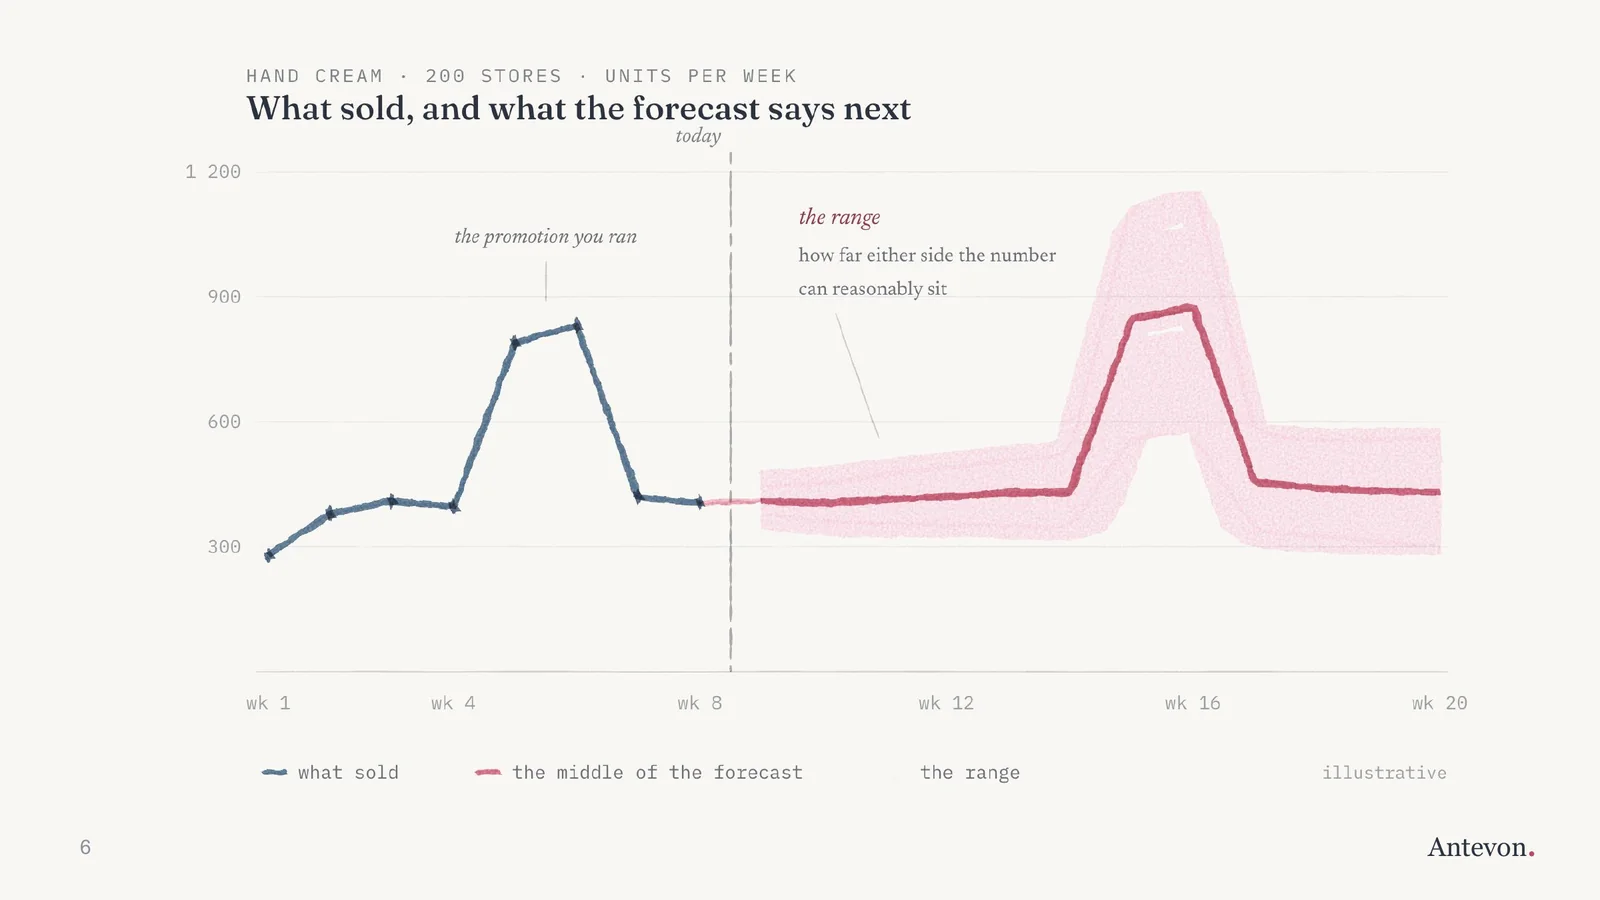
With a range next to a production decision, you stop asking "is the number right", which nobody can answer. You start asking "what do we do about the bottom of the range, and can we afford the top". Those have answers.
Which of last year’s sales were demand driven, and which were price driven?
Look at last year’s sales for your best line. Some units went out at full price to someone who wanted the product. Some went out on a three for two, a gift with purchase, a Black Friday, a retailer’s event that you funded. Do you know the split?
If you do not, last year’s total becomes this year’s baseline. You have now promised growth on a number that only existed at that discount, and you will chase it with another discount, on a smaller margin, just to stand still.
In one example, a product averaged 490 units a week. With the promotion taken out, it was 390. A plan built on the first number starts a quarter too high, before anyone has promised any growth.
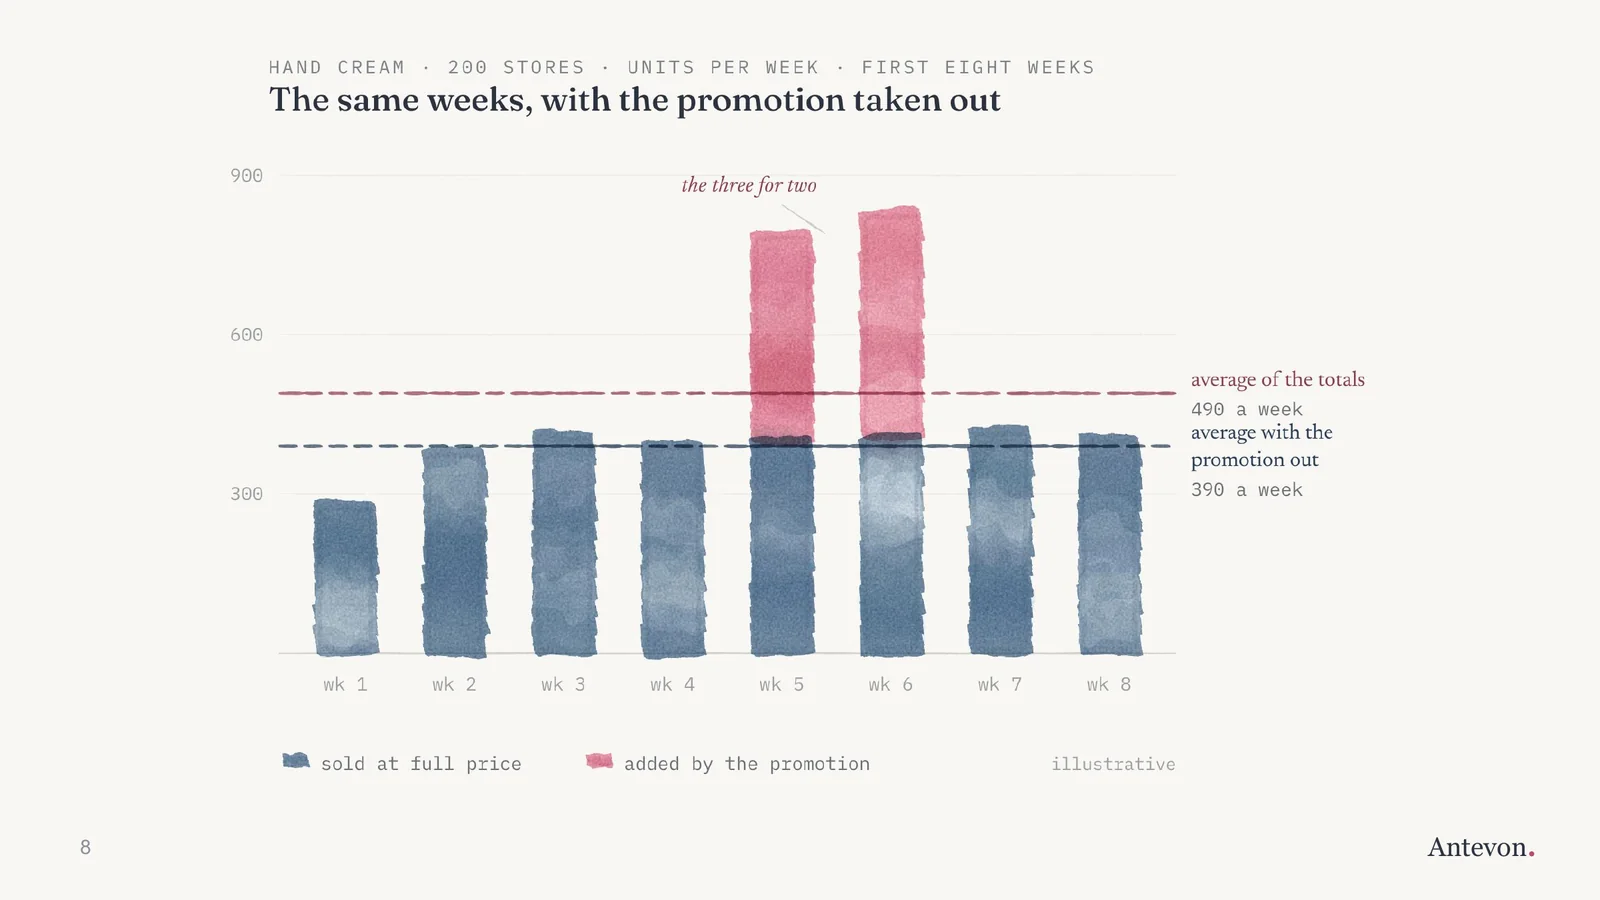
A useful exercise for Monday morning: take your top three lines, mark every promoted week, and look at what is left. That is your baseline. Most brands find one or two products are doing almost all of their full-price business. That tells you which products are worth the growth, and which ones only move when they are cheap.
What does the lift assume?
Every promotion in your plan assumes a lift in sales, and it is usually a round number somebody said out loud in a meeting. Separate the lift you need from the lift you expect.
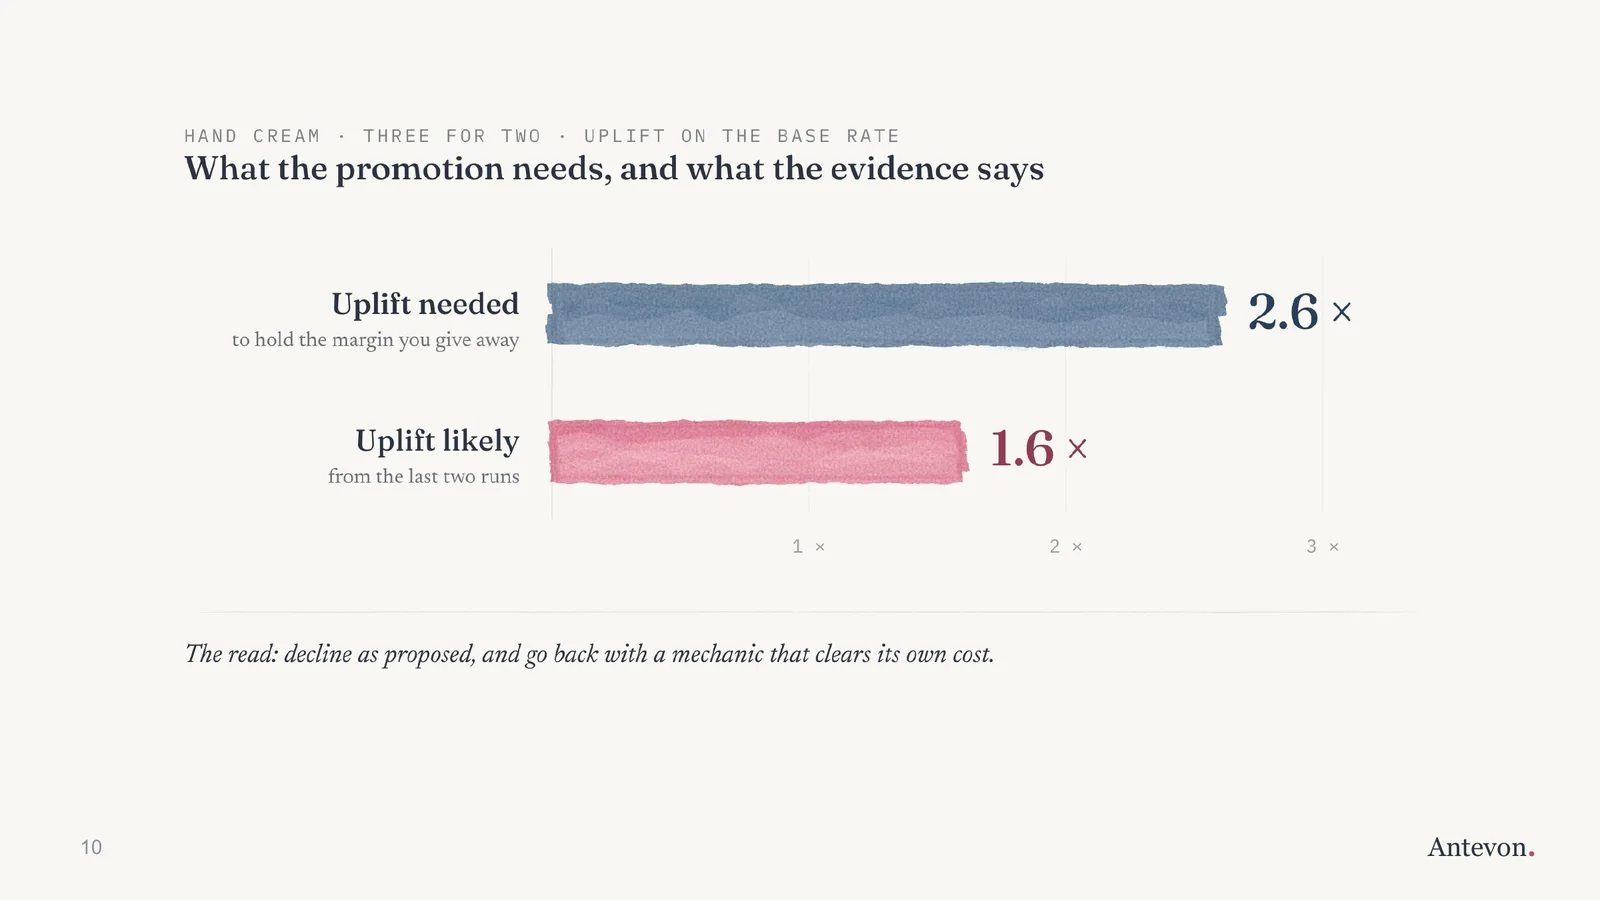
The lift you need is arithmetic: if you give away a third of the value, the volume has to rise enough to cover the margin you gave up. The lift you expect should come from evidence: the last promotion you ran on this product, the same kind of promotion on a similar product, or the retailer’s category data.
Take a three for two on a cream. To hold margin, the volume needed to go up 2.6 times. The last two runs of the same promotion on that product lifted it 1.6 times. So the advice was to go back to the retailer with a different kind of promotion, or be clear what the lower margin buys, such as growth or visibility. Once the assumptions are written down, a promotion becomes a decision you can price, instead of a thing that happens in week five.
When does the growth have to be committed?
This is the one that costs the most money. Making more takes time: components, the transport slot, filling, packing, the retailer’s booking-in window. That can be eight to sixteen weeks. So the commitment for your second batch happens before the first one has sold anything.
Say the first order lands in week one and sales start in week two. Because of the lead time, the second batch has to be committed at week minus four. The first real sales data arrives at week two: six weeks after the commitment, and nothing can be done about it.
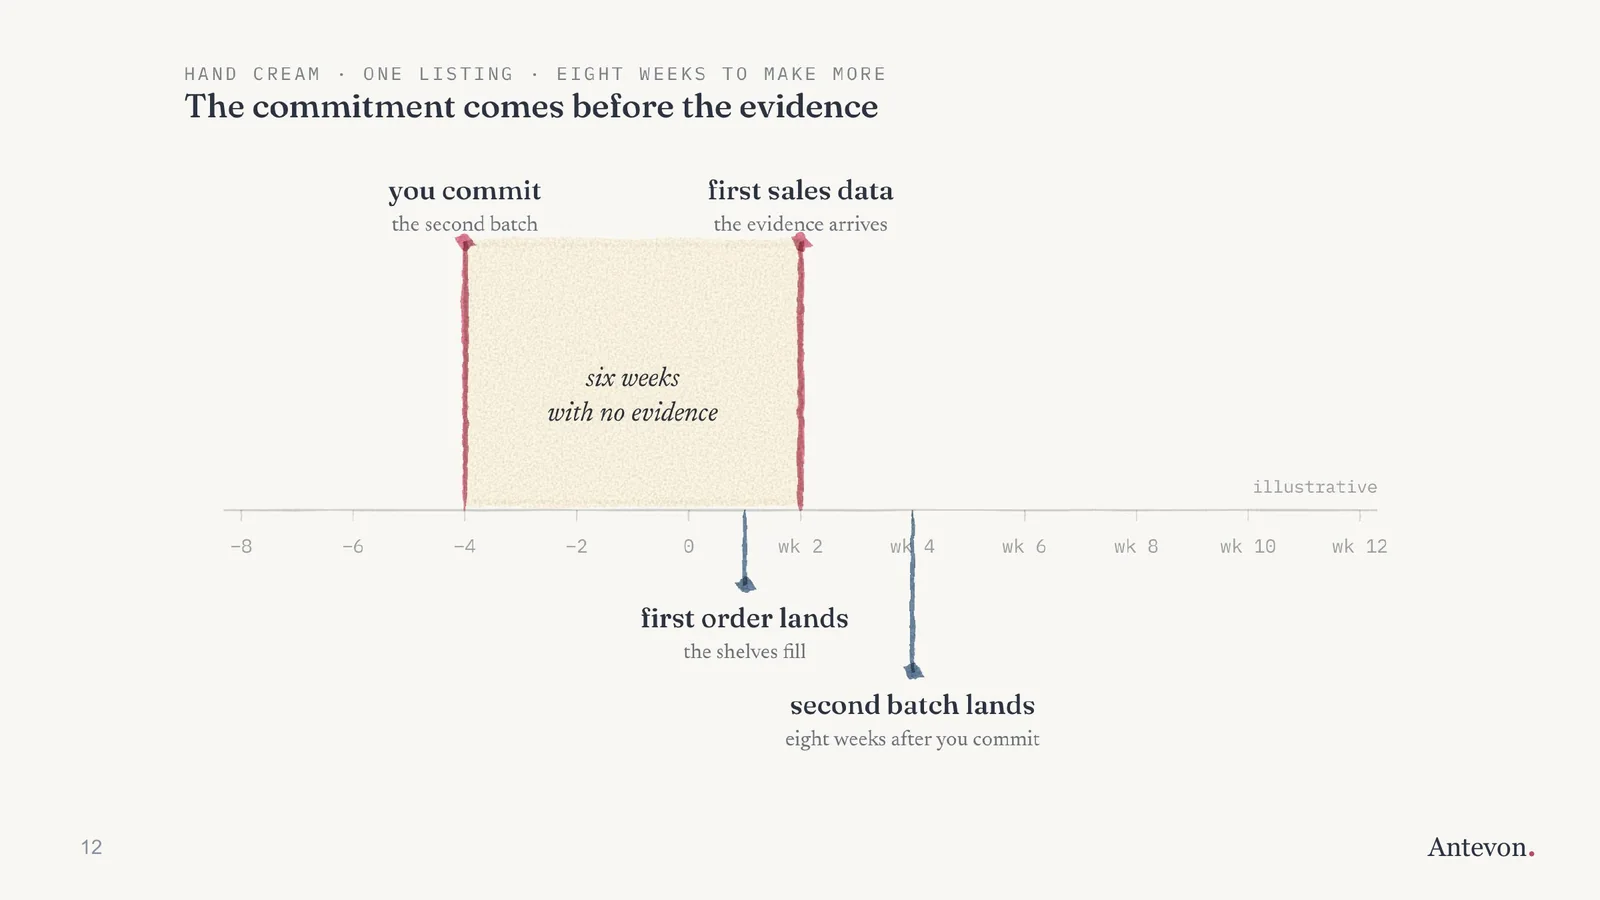
Waiting for data is a decision to be out of stock. A forecast is the tool for deciding before the sales data arrives.
If any of the four made you want to go and look at something, the session did its job. If you want a second pair of eyes, send your four answers to yurii@antevon.com. If you want the forecast built for you, that is what the 2-week audit delivers.